Anti-Poverty Calculations
The big government anti-poverty programs are Social Security, Medicare, Medicaid, the Childrens Health Insurance Program (CHIP), the Earned Income Tax Credit, the Child Tax Credits, and the Supplemental Nutritional Assistance Program (SNAP formerly known as food stamps) (Health Sherpa). By reforming the health insurance system the costs for Medicare, Medicaid, and CHIP can be reduced and controlled. Furthermore, modifying Social Security also reduces the cost for preventing elderly poverty. The only thing left are the other expenses for non Social Security eligible adults (adults 18-65) and their children. The Earned Income Tax Credit, Child Tax Credit, and SNAP are the primary programs for this group and while SNAP is pretty generous EITC leaves a lot to be desired especially for childless young adults.
Therefore, based on the known flaws in the current system and the average household budget I propose a program that eliminates poverty by expanding the EITC to match up to $4,000 in earned wages for all adults, be fully refundable, and not phase out until the median wage. Then everyone who follows three simple steps will be basically guaranteed to reamain above the poverty line.
- Have a roommate; it can be a friend, a spouse, a sibling, a parent, or a complete stranger
- Earn $4000 on average for every adult in your household; for couples one breadwinner could earn the whole $8000 or it could be split up more equitably
- File your taxes
These rules encourage the collaborative American spirit to override the individualistic one in order to help reduce the cost of poverty reduction. Furthermore, earning $4000 is a low bar to clear for almost anyone and because this is a tax credit it also encourages each citizen to file their taxes. Most anti-poverty plans focus on individuals but by encouraging collaboration not only do you help more people you can do it more efficiently as well.
The poverty line for 2 adults is $17,240 (HHS) so if 2 adults earned $8000 the EITC would match it and bring their income to $16000. SNAP would fill in the gaps with a max benefit of $1240 a person or about $104 / month; this is slightly less than the current max benefit but an expanded EITC would make up for it. The phase out for the EITC would start at $20,000 and reduce the benefits by 17% for every extra dollar earned so that the median income household ($68,000) would no longer receive a benefit. The SNAP benefit would follow the same phase out strategy but with a 2.6 % phase out rate. The EITC and SNAP phase in and phase out points should be identical.
For households with children a fully refundable Child Tax Credit of $3500 would make up the difference between the poverty line for 2 adults ($17,240) and the poverty line for a household of 3 ($21,720). The Child Tax Credit would not phase in and be available even to families without income. It should be capped at two children per family however. Unlike the other program the phase out should start, not end, at the median household income and phase out completely by $120,000 in household income, a phase out rate of 6.7 %.
These programs would eliminate poverty as defined by the Federal Poverty Limits and be significantly cheaper and simpler than the current system. While the amounts spent on the ETIC and CTC almost double compared to the current system, SNAP costs go down and all other anti-poverty programs could be eliminated, drastically lowering cost and making the system simpler to understand and apply for. For families that cannot wait until tax time for monetary help, there should be a no interest loan program so households can access their benefits earlier in the year, any differences or discrepancies would be resolved at tax time. The niche anti-poverty measures like WIC, TANF, and LIHEAP could be replaced with by block grants to each State so they could fill any gaps based on localized needs.
Graphs and Tables
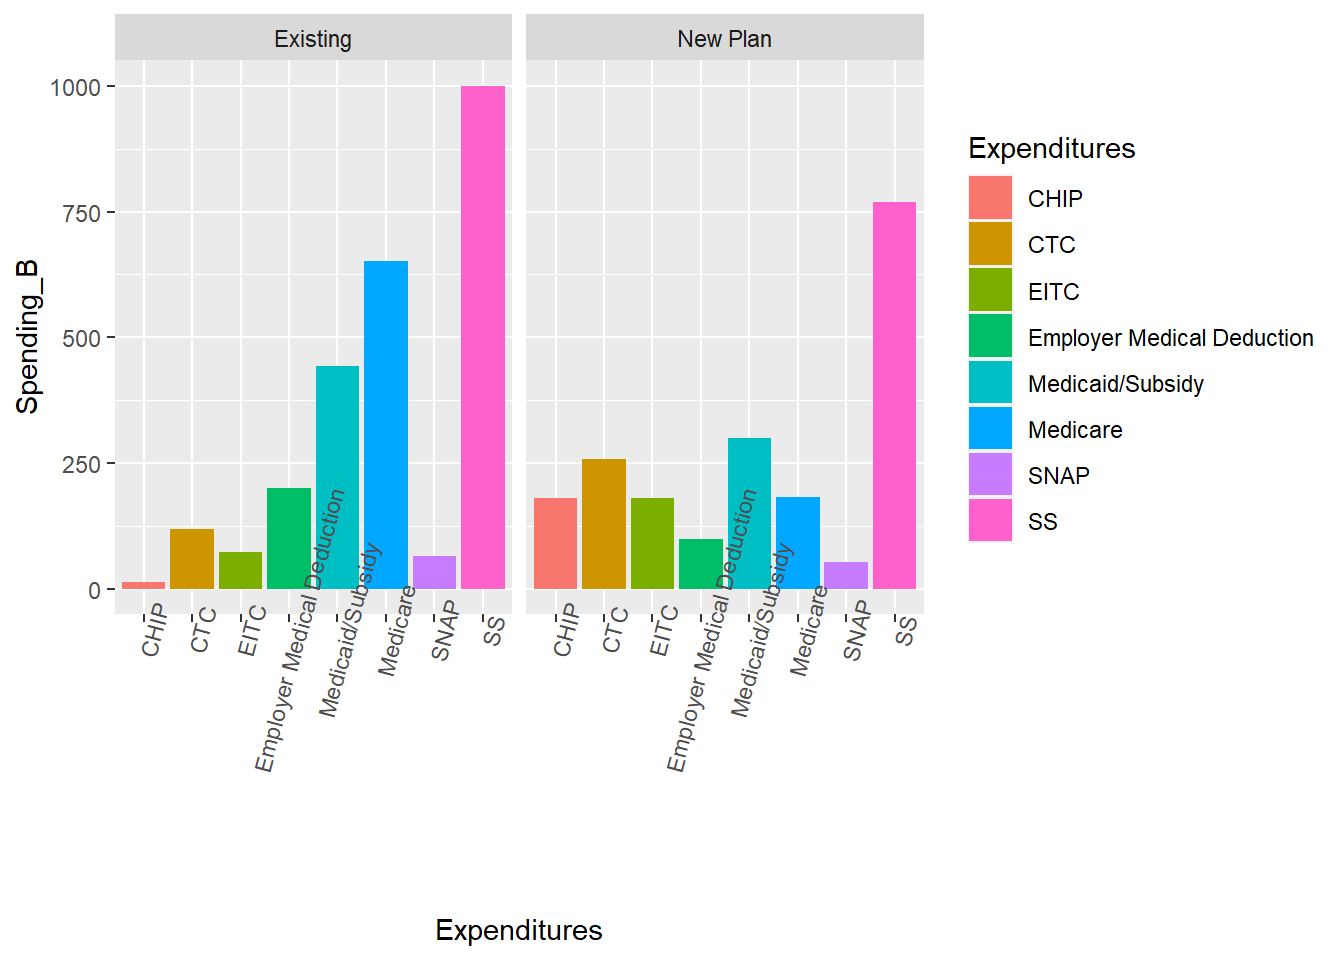
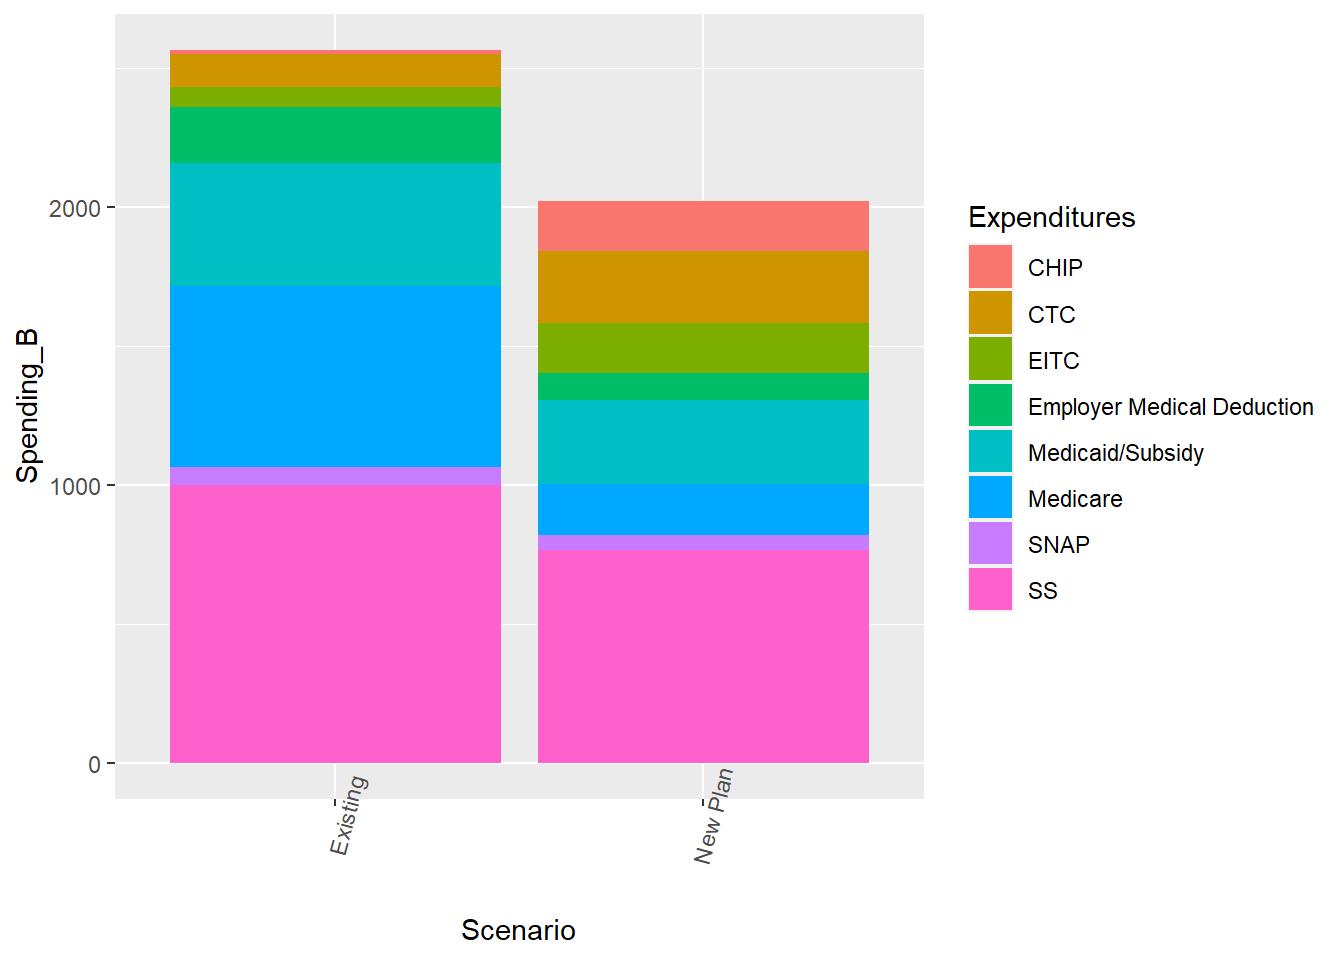
The first two graphs compare the expenditures in Billions of the largest benefit programs in the existing case to the proposed plan. The proposed plan reduces Social Security, SNAP, Medicare, Medicaid/Obamacare Subsidies, and the Employer Medical Deduction, while increasing CHIP (more specifically the amount of children’s health insurance the government subsidizes), the Child Tax Credit, and the Earned Income Tax Credit.
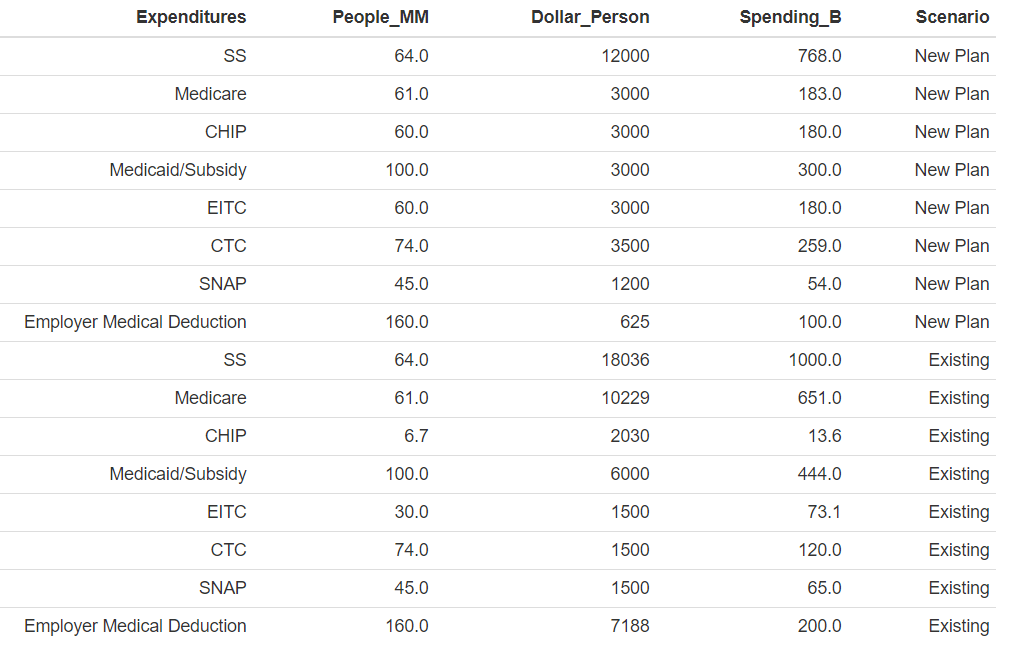
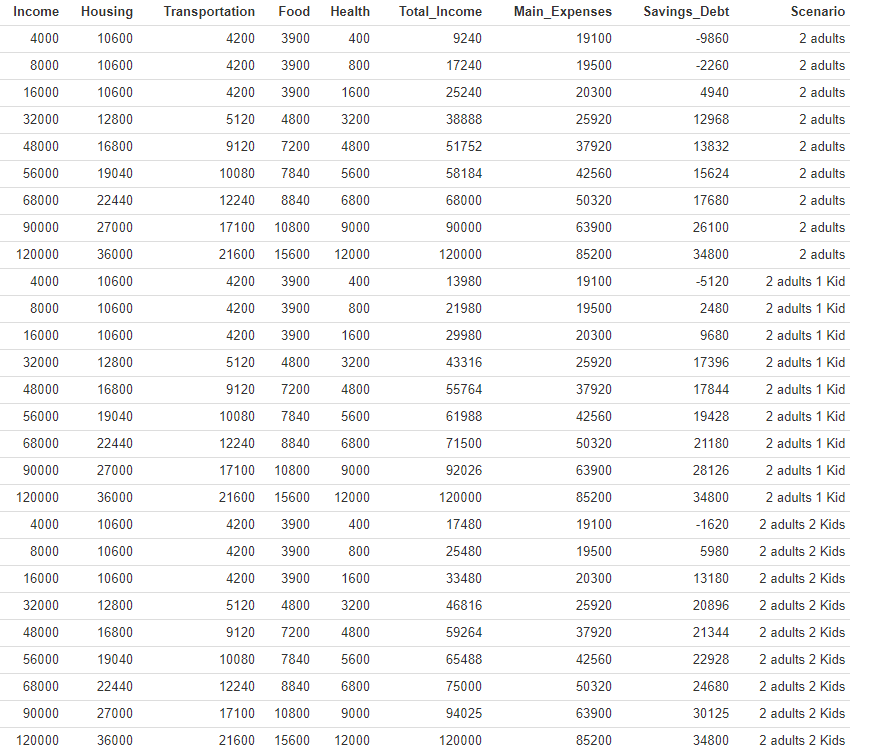
The tables that inform these graphs are also included.
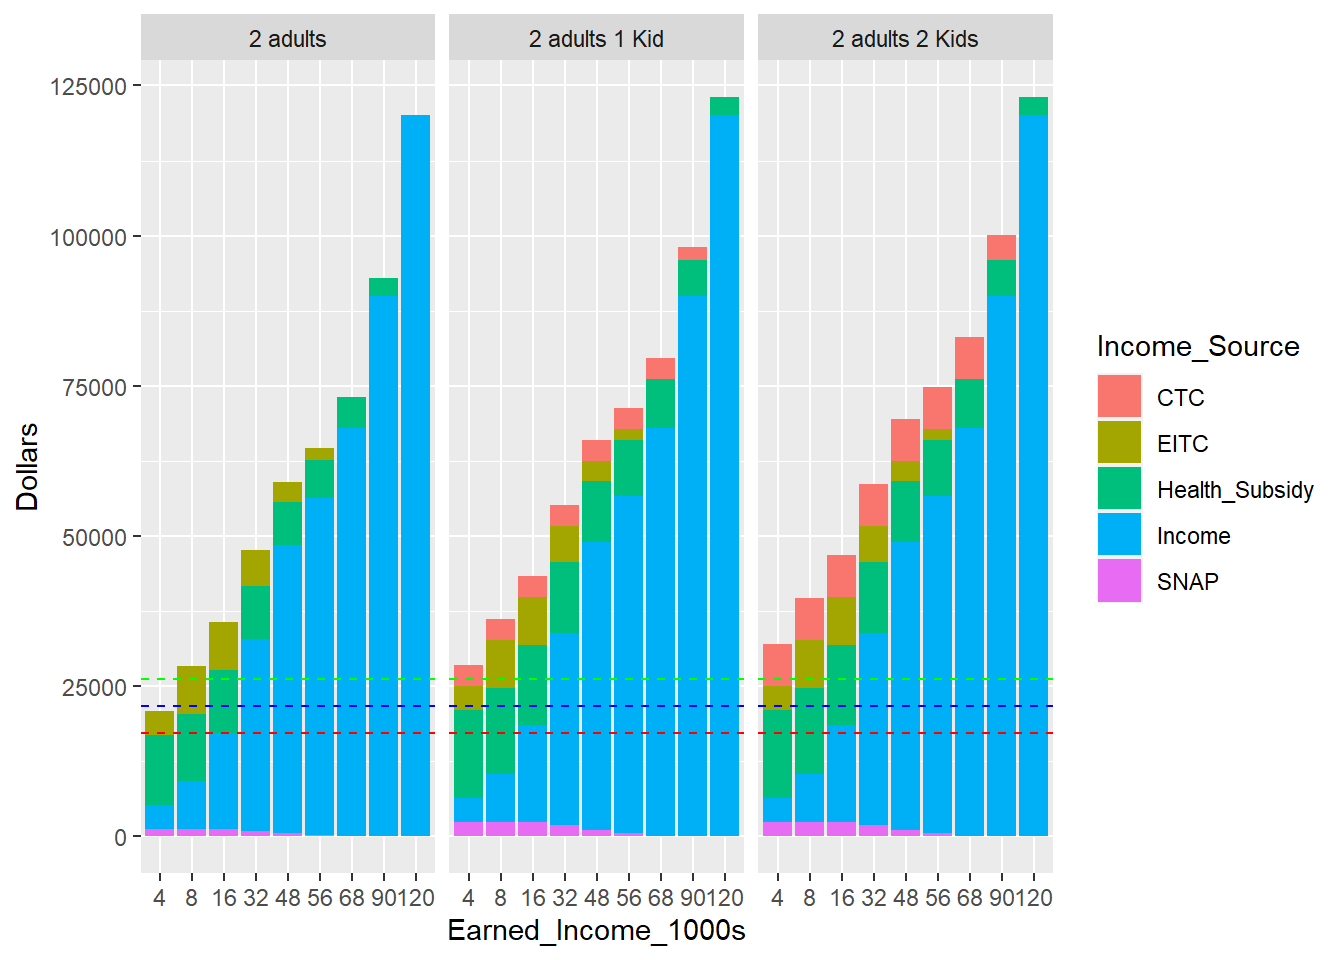
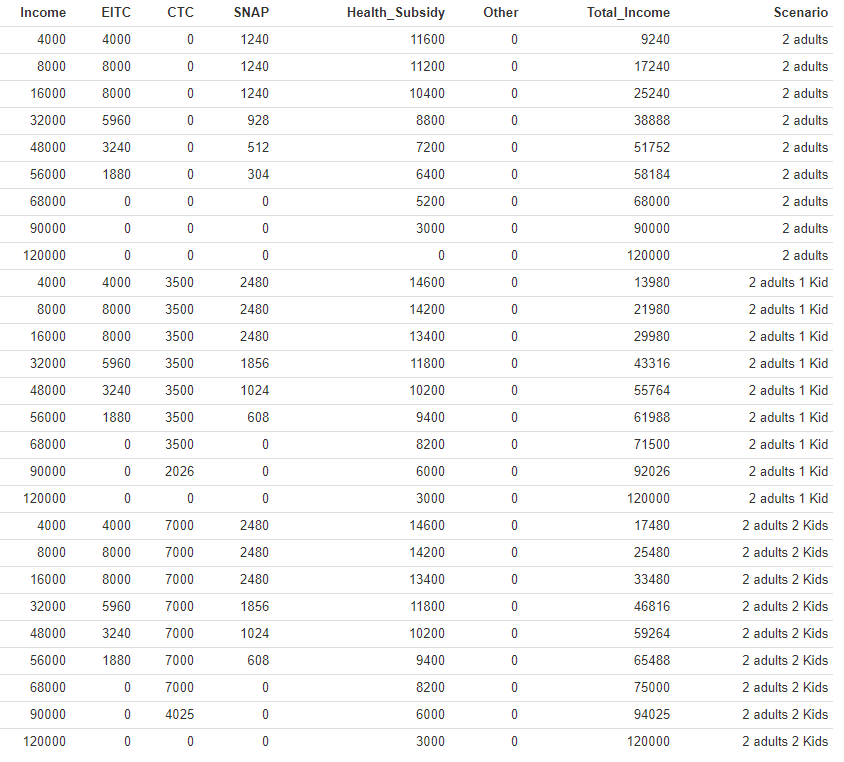
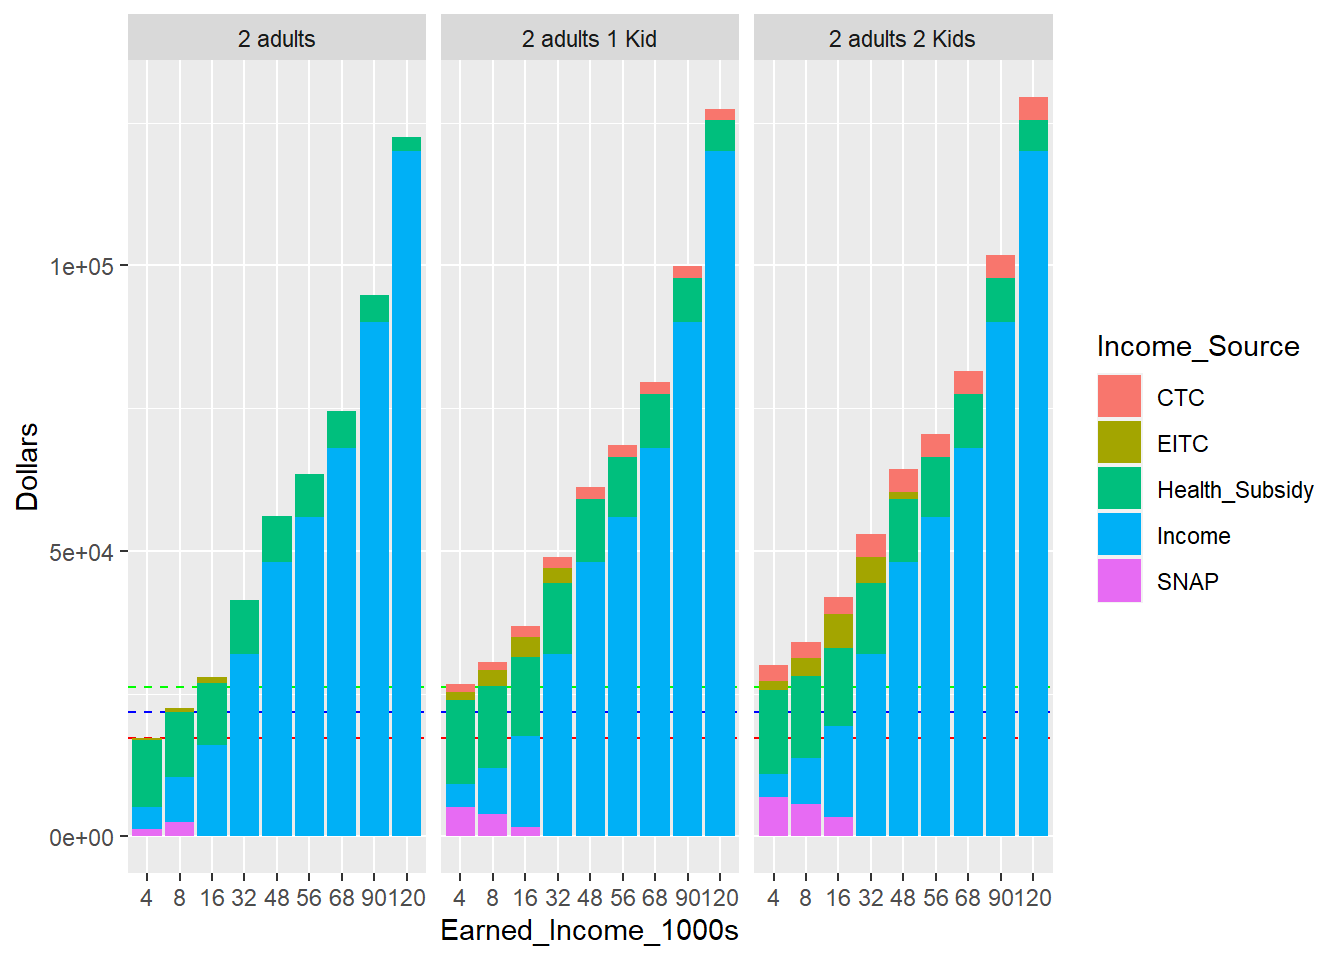
These graphs represent the proposed plan and assume a household size assumes 2 adults in household size 2 and 2 married adults and 1 and 2 kids in households of size 3 and 4 respectively. Some existing benefits have a marriage penalty where two unrelated adults receive more benefits than a married couple that are not accounted for in the household of 2 but are in the households of 3 and 4. The proposed benefits do not have any marriage penalty. The red dashed line corresponds to the poverty line for a household of 2, the blue line the poverty line for a household of 3, and the green line the povery line for a household of 4.
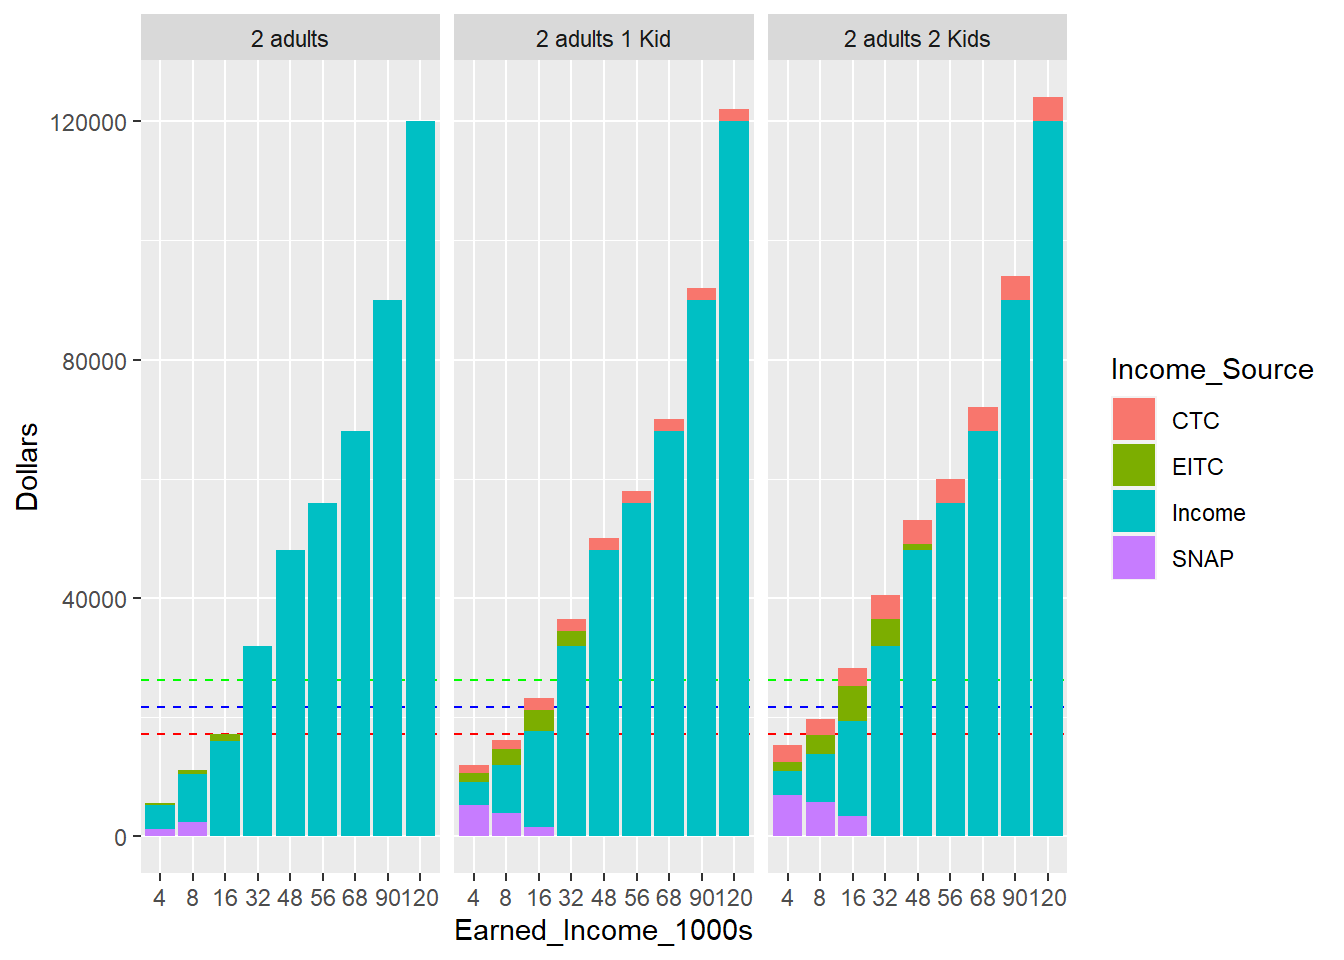
The first graph shows total household income after government benefits sorted by earned wage. It excludes any employer benefits for simplicity. The second graph shows the same information but without the health subsidy so it is easier to visualize how the EITC and CTC help households. These graphs show that the health subsidy is the largest benefit for the households at the lower end and quickly shrinks as income increase. The EITC, SNAP, and CTC also represent a large portion of a lower households income and can dwarf earned income which helps them stay above the poverty line. All benefits decrease steadily with the CTC remaining even for higher income households. All households are above their corresponding poverty lines if you include health subsidies. However, excluding health subsidies almost all households that earn at least $4000 per adult are above their corresponding poverty lines. The only exception is a family of 4 who only bring in $8000, this is due the huge jump in the poverty line between a household of 3 and 4 ($4480) that the CTC can not make up.

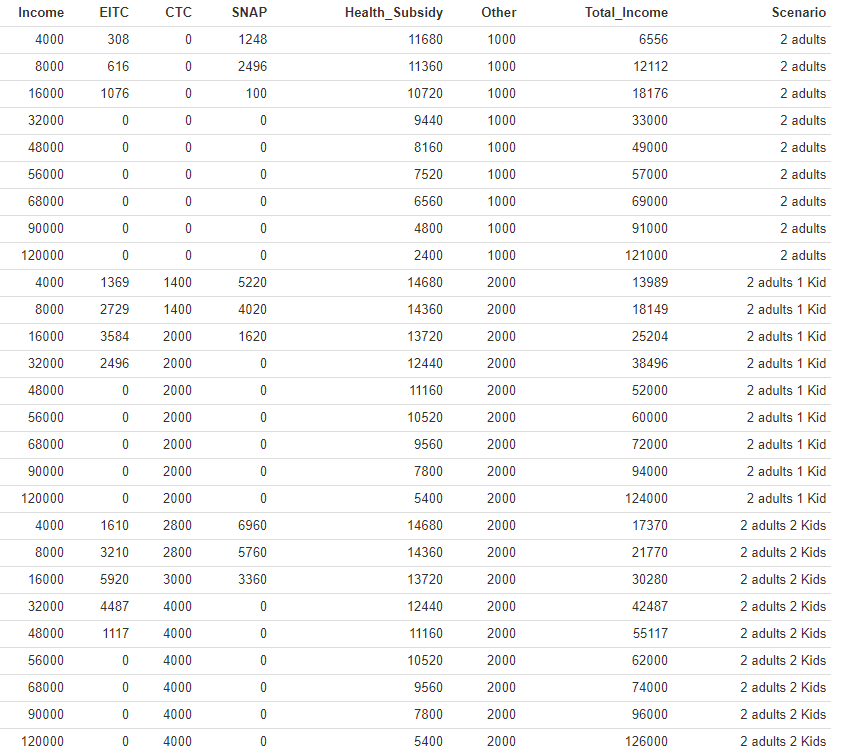
These graphs use the same household definitions as the houses above, but illustrate the existing paradigm.
Existing Mean Tested Transfer increased the lowest quintile income by $14,600 to an average of $35,900 from $21,300 (CBO). Medicare and CHIP are 70% of all mean tested transfer and 40% of all average income for those in the lowest quintile, 11% in the second quintile, and 4% in the middle quintile. SNAP makes up 9% of all mean tested transfers, SSI 8%, and other programs 13% with them providing 10% of the lowest quintiles income.
I assumed that other existing transfers totaled $1000 per person up to a max of $2000 per household which is roughly the 10% of income for the existing case.
While the general trends of the existing scenario mirror that of the proposed plan the benefits are far less generous. The health subsidy is still the largest benefit for lower income households, but SNAP is the next largest instead of the EITC. Furthermore, the EITC and CTC are relatively small even for households with 2 children and SNAP does most of the work of raising a families wages. With the healht subsidy all households stay out of poverty. However, not counting the health subsidies families who earn less than $16,000 remain in poverty which is more than double the income needed to stay out of poverty in the proposed plan.
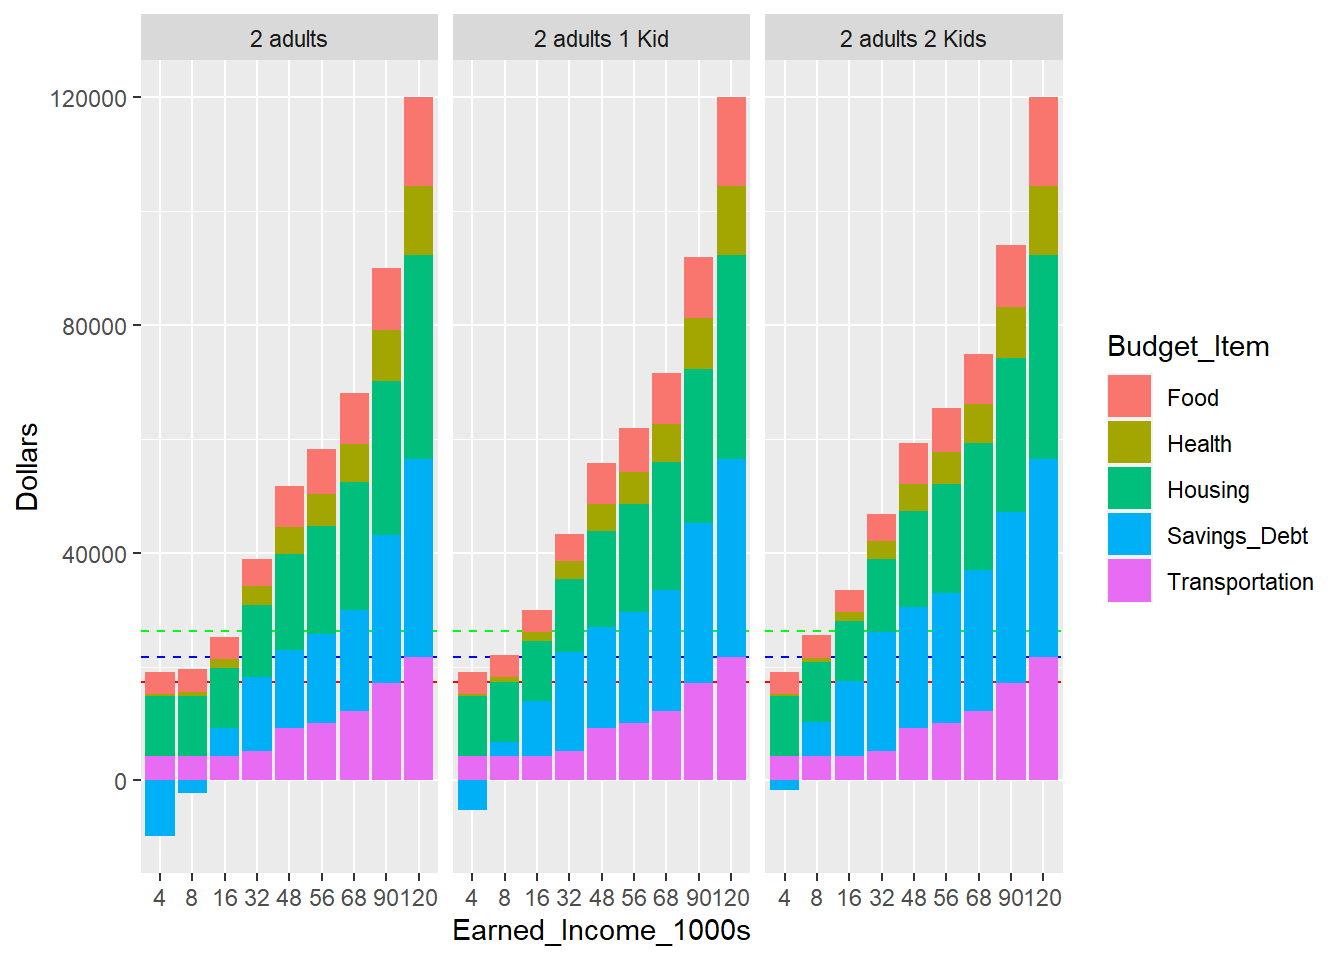
Household Budgets
The aforementioned laws and programs are designed to help either reduce the cost of necessities, increase wages, or eliminate poverty. So for reference, using annual expenditure data from the Bureau of Labor Statistics, I illustrate with the graphs below how much each household spends by income. These show that most households spend themselves out of poverty even if they require debt (the poverty dashed lines are the same as in the graphs above). These graphs also show that the new EITC and CTC would cover a significant portion of Housing and Food costs, while the new health subsidies would cover the majority of health costs.
Other Sources
Means Tested Income, Taxes, and Transfers
All Child Tax Credits and EITC
Largest Government Expenditures
Federal Support for Higher Education
Annual Expenditure by Decile 2019